


Join StarRocks Community on Slack
Connect on SlackOur app is a free messaging and calling app that connects more than one billion users across the world. Users can chat and make calls with families and friends, share favorite moments, enjoy mobile payment, and do things much more on the app. The app has become an important lifestyle that is woven into the fabric of people's everyday life.
Introduction to Monitoring Systems
Monitoring systems are mainly categorized into three types: framework monitoring system, monitoring system with custom metrics, and cloud-native observability platform.
Framework monitoring system: This system uses a customized built-in module to monitor calls between modules. The metrics include call chains of modules, main calls, background calls, average time of calls, and failures.
Monitoring system with custom metrics: This system is used to monitor business activities, such as payment, failed calls made to merchants, and success rates of app notifications. The monitoring task is completed on two platforms: a two-dimensional monitoring system and a multidimensional monitoring system.
In the two-dimensional monitoring system, users can monitor business activities in only two dimensions: user ID and Key columns. Users must first apply for an ID and then define key columns. This type of monitoring can be used only in limited scenarios to meet basic monitoring requirements. A more advanced OLAP platform for multidimensional monitoring is required.
The multidimensional monitoring system is more suitable for complex monitoring, especially for monitoring sales by city, by e-commerce operator, and error codes.
Cloud-native observability platform: This platform collects telemetry data, such as metrics, logs, and trace data from various sources and is compatible with OpenTelemetry.
This article introduces how StarRocks helps improve the multidimensional monitoring system for our app.
Original Architecture and Pain Points
The multidimensional monitoring system in our company is a flexible and self-service OLAP platform based on various dimensions.
This monitoring system involves the following three important concepts: protocols, views, and anomaly detection platform.
- Protocols refer to user-defined monitoring tables that provide two types of information: dimensions and metrics. Dimensions are fields (data attributes) that can be filtered and aggregated. For example, if the system needs to monitor calls on some modules, the dimensions are modules and calls. Metrics can be aggregated by using functions, such as SUM, MAX, MIN, and UNIQUECOUNT.
- Views are time curves that are obtained after the dimensions and metrics of monitoring tables are sorted and aggregated. Views facilitate problem location and troubleshooting.
- The anomaly detection platform monitors anomalies in views by using algorithms, thresholds, and fluctuations, and reports alerts in a timely manner.
Business Scale
Business scale of our multidimensional monitoring system:
- Protocols: more than 3,000 protocols (corresponding to 3,000 dimension tables).
- Data volume: Dimension tables contain a huge amount of data, with a maximum load speed of 3.3 billion records per minute and 3 trillion records per day.
- Concurrency: a maximum of 330,000 concurrent calls per minute made by the anomaly detection platform during peak hours.
Business Characteristics
The multidimensional monitoring system has the following business characteristics:
- Detailed data does not need to be retained. Data is aggregated based on dimensions and only aggregation models are required.
- Single-table queries are most frequently performed. Each protocol is an independent single table. Multi-table queries are not required.
- High-frequency queries are fixed and predictable. One of these queries is TopN queries on various dimensions. For example, TopN queries are performed to obtain the top 3,000 modules that report the largest number of items. Another is time-series queries on multiple dimensions, such as GROUP BY time_minute.
The multidimensional monitoring system has the following requirements:
- Stable, low-latency data load for handling a huge number of query requests
- OLAP engines that support aggregate models
- Support for single-table high-concurrency queries. OLAP platforms mainly run single-table queries and therefore require high single-table query performance. In addition, the anomaly detection platform needs to pull a large number of curves in real time and monitor and process the curves every minute. Therefore, high concurrency must be supported.
- Indexes must be configured based on data characteristics and materialized views are required to accelerate queries.
Original Architecture
Our monitoring platform processes a large number of protocols from various data scenarios. The data scenarios can be classified into four categories based on the volume of reported data and dimension complexity per minute (number of dimension combinations).
- Small data volume with simple dimensions (Most data belongs to this category.)
- Large data volume with simple dimensions
- Small data volume with complex dimensions
- Large data volume with complex dimensions
Overall data processing and analysis procedure:
- Data collection. Data is stored in shared memory. Agents keep polling data from this shared memory.
- Data preprocessing and distribution. Agents asynchronously allocate data to the proxy of centralized control. The proxy is responsible for data sampling and routing. Data preprocessing and transformation also take place in this phase.
- Data storage and processing. Preprocessed data is stored in persistent Apache Kafka® queues. Only a small portion of this data is consumed directly by Apache Druid®. Most data is pre-aggregated by Apache Flink®, which aggregates detailed data every six seconds and rewrites data back to Apache Kafka for Apache Druid to consume.
- Data application. Apache Druid queries data and provides query results first to the Web and then to the anomaly detection platform. The anomaly detection platform uses query results to detect alarms and trigger alerts.
Pain Points
The previous architecture uses the following methods to store and compute data:
- Small data volume with simple dimensions: Data is directly processed by Apache Druid.
- Large data volume with simple dimensions: Data is first pre-aggregated by Apache Flink and then loaded into Apache Druid. In this scenario, more than 30 million rows of data are reported to protocols per minute and the data has 100,000 dimension combinations.
- Small data volume with complex dimensions: If data is directly processed by Apache Druid, data query is slow. In this scenario, data reported to protocols per minute may generate millions or tens of millions of dimension combinations.
- Large data volume with complex dimensions: Current OLAP products are not capable of processing data at this scale.
Our multidimensional monitoring system excessively relies on Apache Druid and is confronted with the following pain points:
- Apache Druid's architecture is complex, which has six different types of nodes, such as real-time nodes, historical nodes, and query nodes. This architecture relies on external components such as MySQL, Apache ZooKeeper™, and HDFS.
- Apache Druid supports roll-up in single dimensions but does not provide materialized views. Queries on complex dimensions are difficult to optimize. Customers must design additional optimization measures to achieve a similar effect as materialized views.
- Apache Druid does not support partitioning and therefore cannot accelerate queries in some scenarios. Apache Druid stores data by time chunks, and data of the same time interval is stored in one chunk. If the workloads are not time-sensitive, the performance of Apache Druid is unsatisfactory.
- Apache Druid has poor query performance for high-cardinality fields. Although Apache Druid has high performance in high-concurrency queries on simple dimensions, it cannot provide satisfactory query performance for high-cardinality fields and often results in slow queries.
To resolve the preceding pain points, we have thoroughly tested and verified the performance of StarRocks when we introduce other OLAP platforms.
Advantages of StarRocks:
- StarRocks supports both the Aggregate Key model and the Duplicate Key model. The two models meet our requirements for data aggregation and query of detailed data.
- StarRocks supports partitioning and bucketing, which facilitates data optimization and accelerates queries.
- StarRocks provides flexible materialized views to aggregate data dimensions that are commonly queried. StarRocks automatically chooses the most suitable materialized views to optimize queries, which eliminates the need for us to manually organize queries based on code logic.
- StarRocks supports high concurrency.
Performance Testing on StarRocks
We use real data to test the performance of StarRocks on our platform from different aspects.
Data Loading
We use StarRocks Routine Load jobs to import JSON data from Apache Kafka.
Hardware configuration: 48 physical cores with hyper-threading enabled (total of 96 logical cores), Intel® Xeon® Platinum 8255 Processor, 192GB RAM, 16TB NVMe SSD; 5 hosts
Data source: real online data with a data load speed of 50 million rows per minute and an average size of 1 KB JSON data per record.
Test procedure: Data is first imported into Apache Kafka and accumulated for a certain period of time before StarRocks begins to consume the data. This helps pressure test the maximum load speed of StarRocks.
Settings of key parameters:
- routine_load_task_consume_second = 30;
- routine_load_task_timeout_second = 60;
- max_batch_rows = 20,000,000;
- desired_concurrent_number = 5;
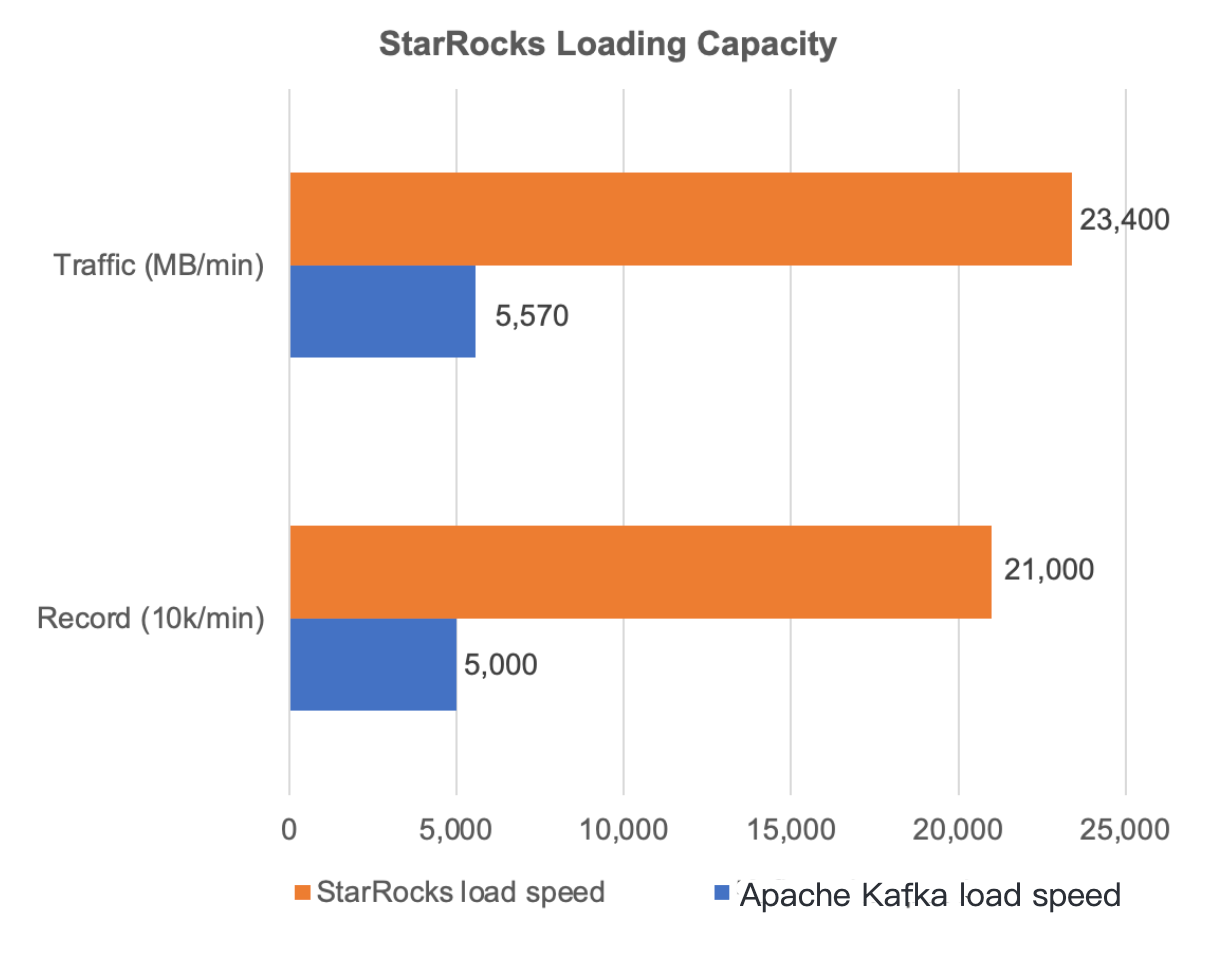
Test results: StarRocks demonstrates excellent loading performance. In the preceding figure, about 50 million records are loaded from Apache Kafka to StarRocks per minute. However, StarRocks can consume as many as 210 million records per minute from Apache Kafka, which is much higher than the write speed of Apache Kafka and fully meets our requirements for data loading.
Query Performance
Hardware configuration: 48 physical cores with hyper-threading enabled (total of 96 logical cores), Intel® Xeon® Platinum 8255 Processor, 192GB RAM, 16TB NVMe SSD; 5 hosts
Cardinality: 11,500,000 cardinalities (exclude the time dimension)
Database version: StarRocks 1.18.1, Apache Druid 0.20.0
Query response time in low concurrency scenarios
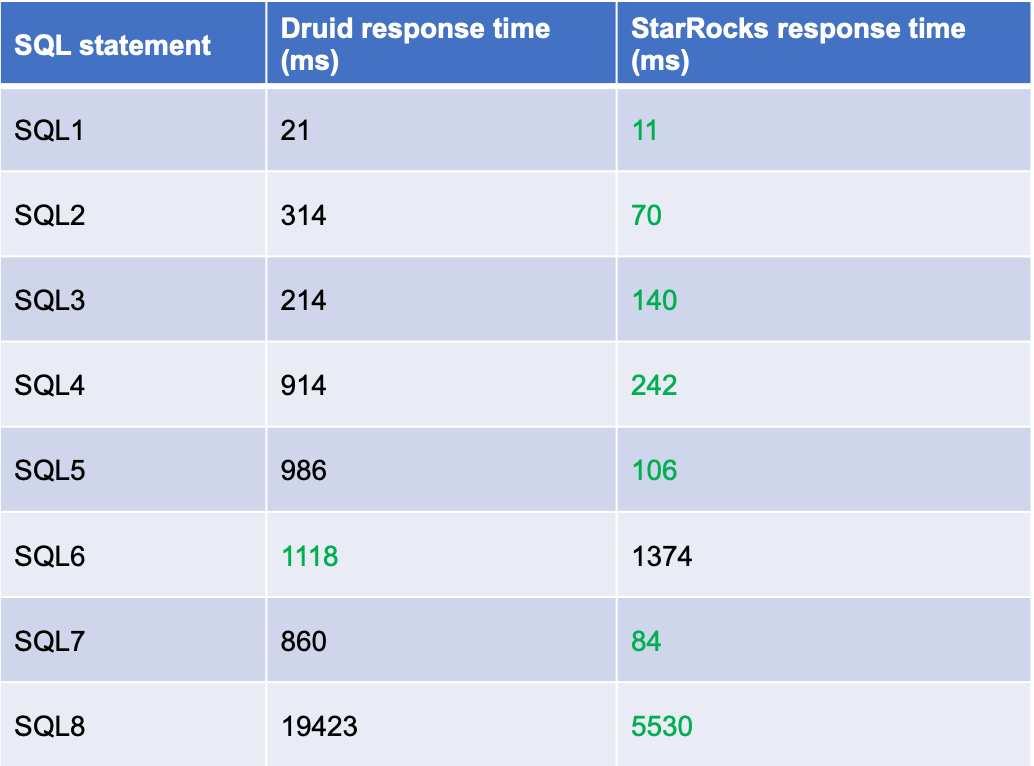
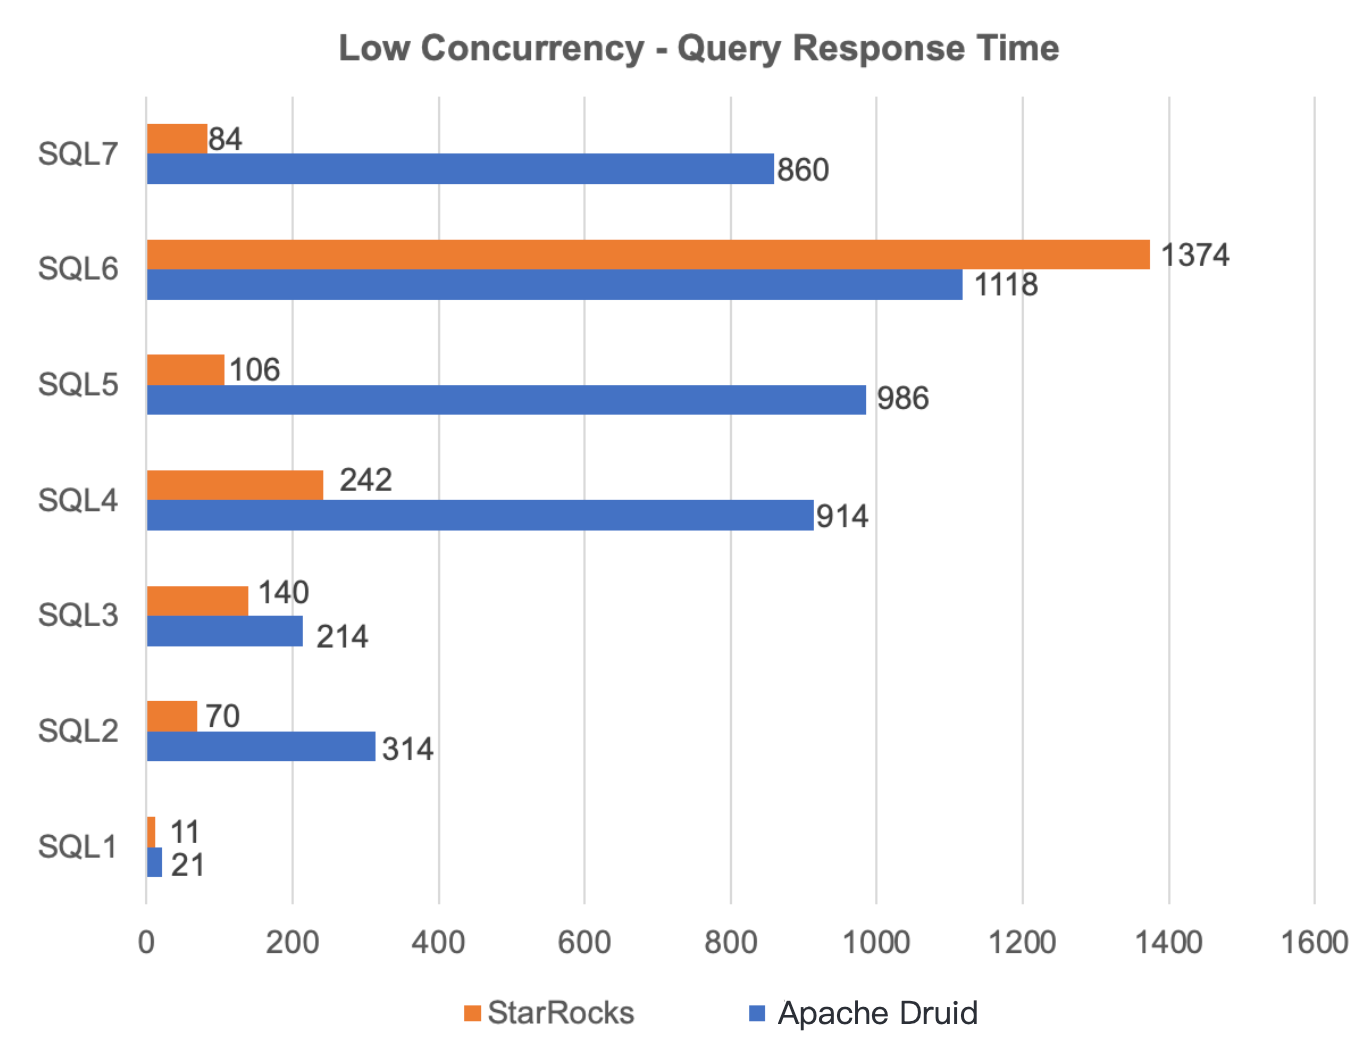
We use StarRocks and Apache Druid to make four time-series queries and four TopN queries in low-concurrency scenarios. Each query was performed five times, and the average value was used as the final result. During the process, Apache Druid rolls up data on all dimensions, and StarRocks uses materialized views.
StarRocks outperforms Apache Druid in 7 out of 8 tests over data with complex dimensions. StarRocks still performs very well in slow queries (TopN queries on high-cardinality fields). StarRocks completes the query within 5s, whereas Apache Druid takes about 20s. In conclusion, StarRocks performs far better than Apache Druid in low concurrency scenarios.
QPS in high concurrency scenarios
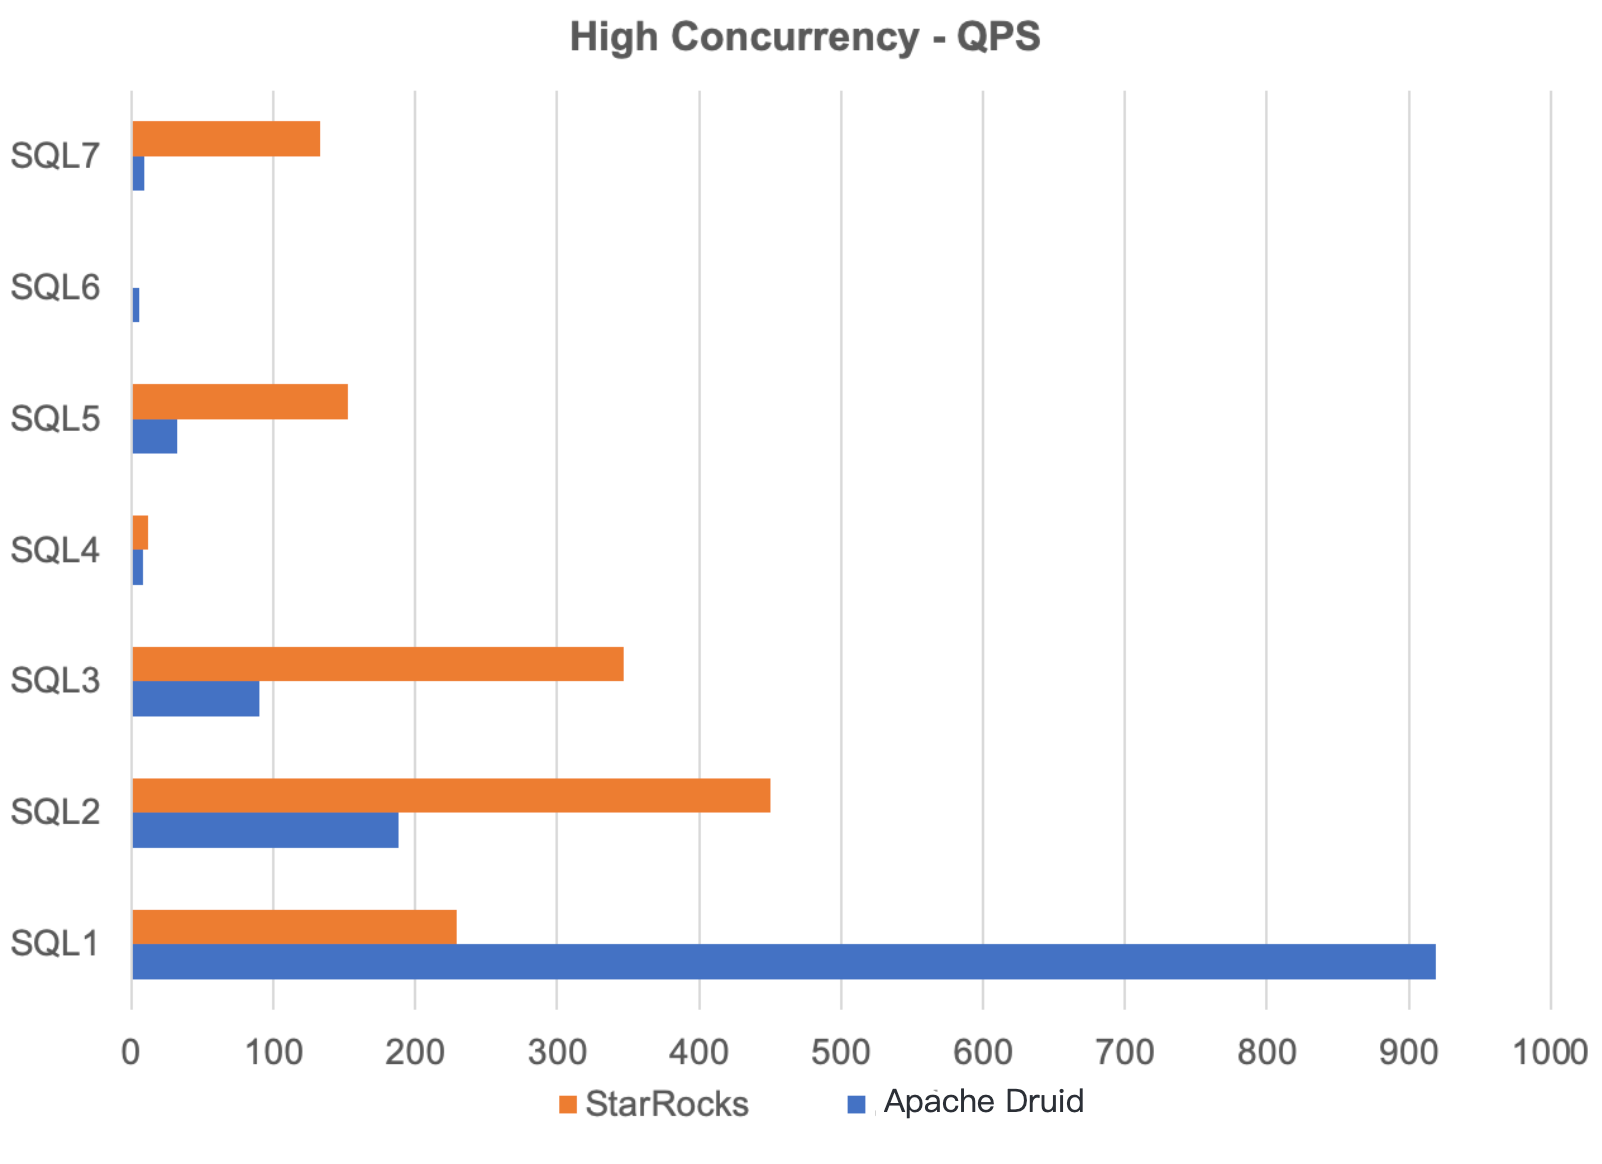
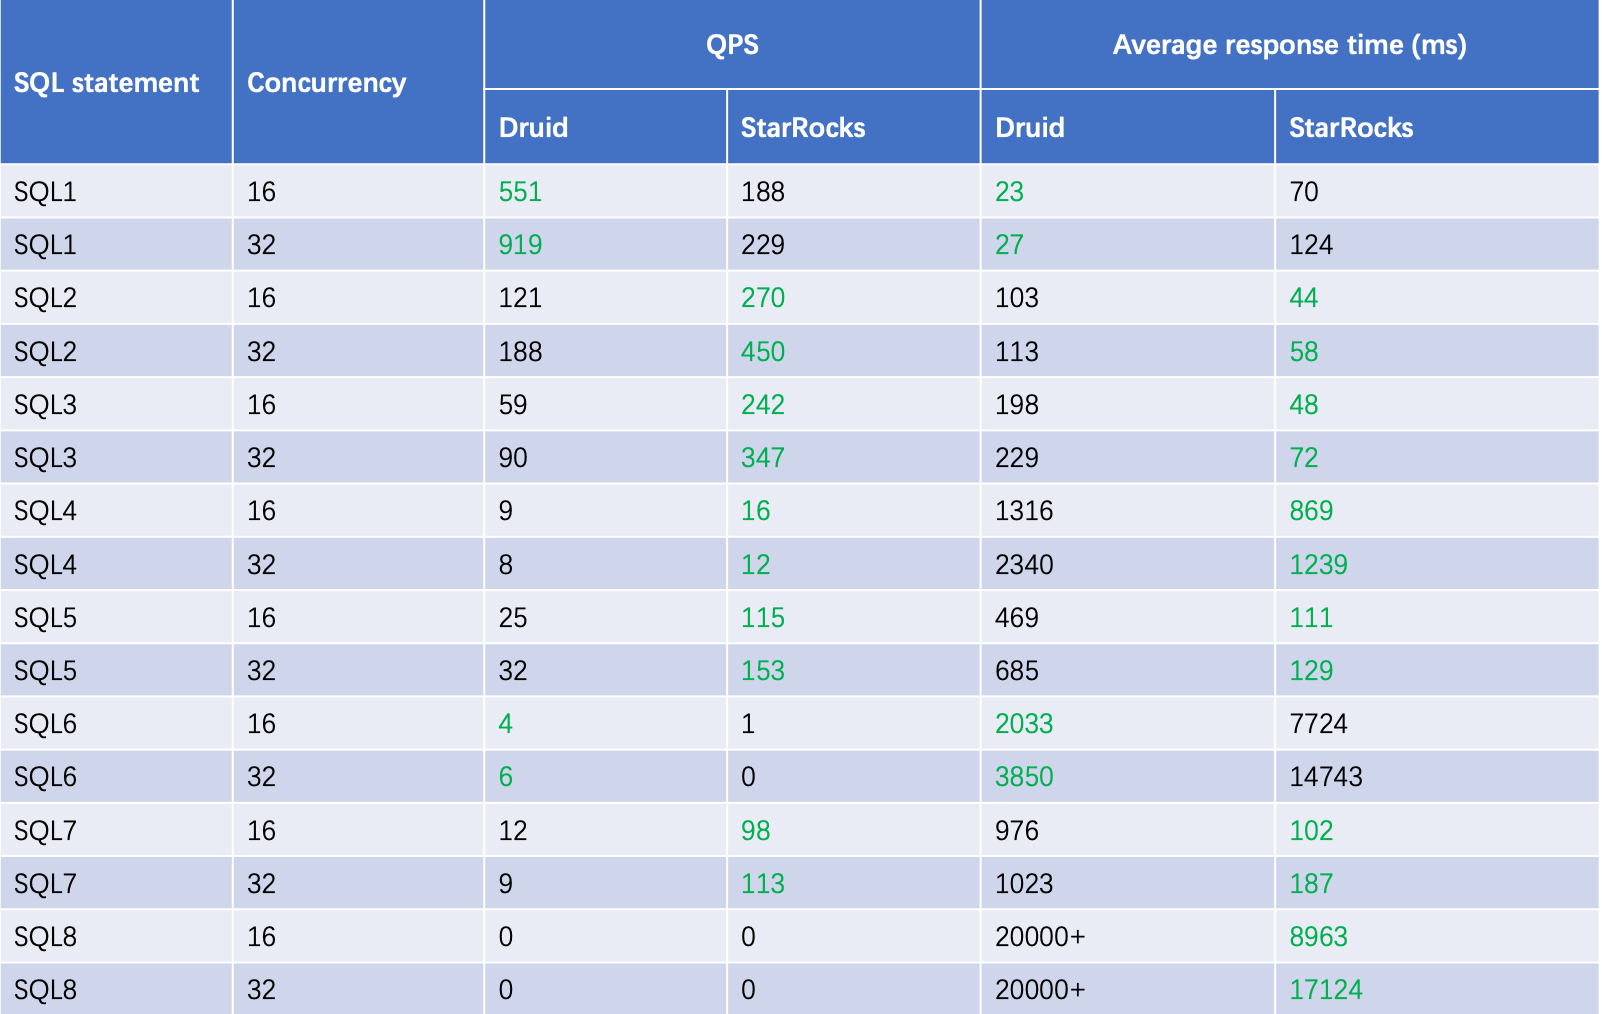
To simulate high concurrency, we use the same eight SQL statements to run 16 and 32 concurrent queries. We measure the QPS and average query response time of Apache Druid® and StarRocks. As listed in the table above, StarRocks outperforms Apache Druid in 12 out of 16 tests, and has a higher QPS than Apache Druid in 10 tests. However, both of the two cannot complete slow queries in high concurrency scenarios.
In conclusion, for high-concurrency queries on protocols with complex dimensions, StarRocks outperforms Apache Druid with flexible bucketing and materialized views. We also find that the query concurrency supported by StarRocks has a strong correlation with its CPU usage. The performance downgrades when the CPU usage rises high. However, Apache Druid is more stable.
StarRocks vs. Apache Druid®
| Vendor | Strength | Weakness |
| StarRocks |
|
|
| Apache Druid |
|
|
Adoption of StarRocks in the Multidimensional Monitoring System
The following figure shows the new architecture of our multidimensional monitoring system. Both StarRocks and Apache Druid are used as the storage and compute engines for the system.
StarRocks outperforms Apache Druid in data queries with complex dimensions. Therefore, we have migrated real-time compute and storage workloads of some complex protocols from Apache Druid to StarRocks. We also have migrated a total of 9 protocols to StarRocks, covering areas such as payment, video channels, search, and security.
The peak load speed has reached 70 million rows per minute and 60 billion rows per day. The average response time has been reduced from 1,200 ms to about 500 ms. That for slow queries has been reduced from 20s to 6s.
Summary and Outlook
Our multidimensional monitoring system connects to thousands of data sources and various data scenarios. The extraordinary performance of StarRocks helps us resolve many issues which cannot be resolved in the Apache Druid architecture. We will continue to use these two OLAP engines as our major storage and compute engines. Meanwhile, we will actively explore the application of StarRocks in more scenarios.
We hope to see performance improvements of StarRocks in high concurrency and high CPU load scenarios. StarRocks' incoming release of decoupled storage and compute will further enhance its system stability. We believe StarRocks will go further on its journey towards a unified and ultra-fast OLAP database.
Apache®, Apache Flink®, Apache Kafka®, Apache Druid®, Apache ZooKeeper™ and their logos are either registered trademarks or trademarks of the Apache Software Foundation in the United States and/or other countries.