


Join StarRocks Community on Slack
Connect on SlackTrip.com is the world's leading travel platform that provides booking services for over 1.5 million hotels worldwide. At the moment, 70% of the real-time scenarios on our lodging BI platform are already deployed on StarRocks. The average query response time is about 200 ms. We saw a significant reduction of those with response time longer than 500 ms. Meanwhile, the cost of human resources and hardware have decreased greatly. We are planning to migrate all the remaining real-time scenarios and all the offline scenarios to StarRocks in the future.
Status Quo with ClickHouse
Our big data business intelligence platform is a platform that provides data visualization to the company’s lodging business line. It represents and interprets data intuitively by charts showcasing, to provide the team knowledge and insights, so that they could make decisions quickly and correctly.
In our lodging department, the metrics each team cares about are different, the permissions and authorities are not the same as well. So the ways that the data is showcased are diversified.
Our website receives about 2200 UVs and 100,000 PVs every day. The number will be doubled or even tripled during holidays.
PV (in thousands)
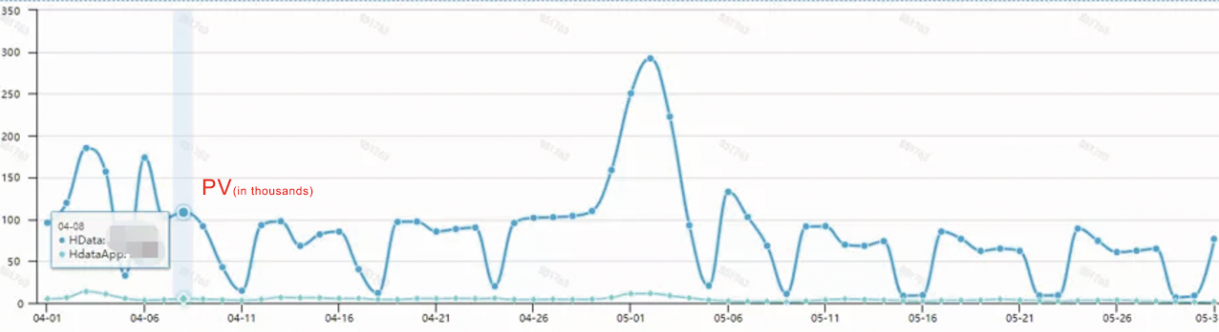
We initially used ClickHouse in 2018. 90% of our business line relied on ClickHouse heavily since then. With the powerful performance of ClickHouse query, 95% of the response time was within 1s.
Now we have about 70 billion records, more than 2000 processes every day. The amount of records that need to be updated is about 15 billion daily.
Uncompressed data: 8T, compressed data: 1.75T.
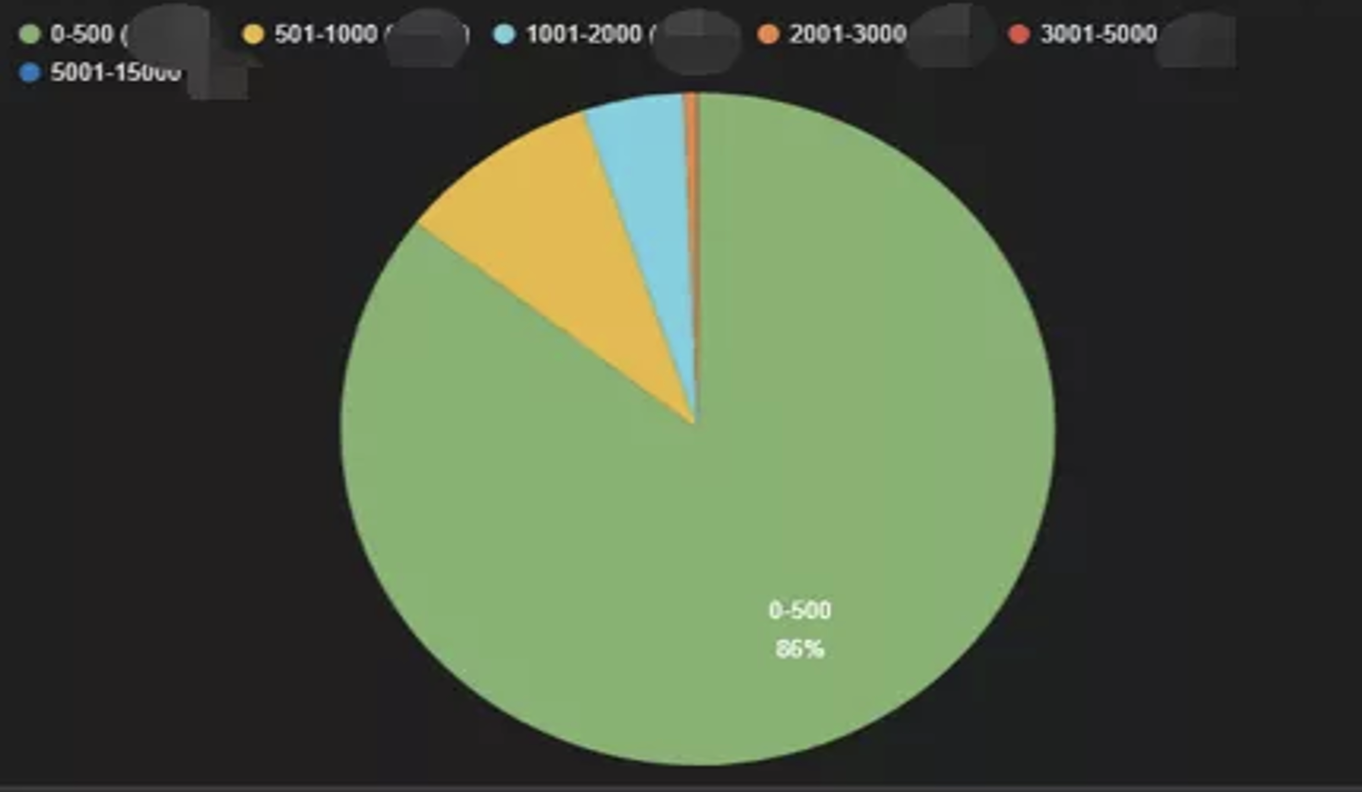
Query length interval distribution
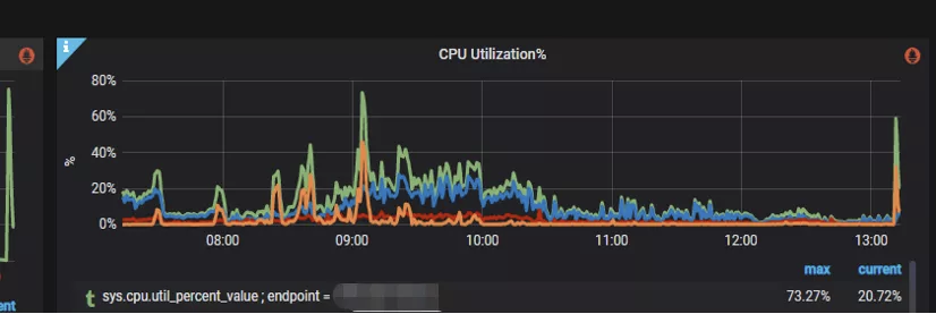
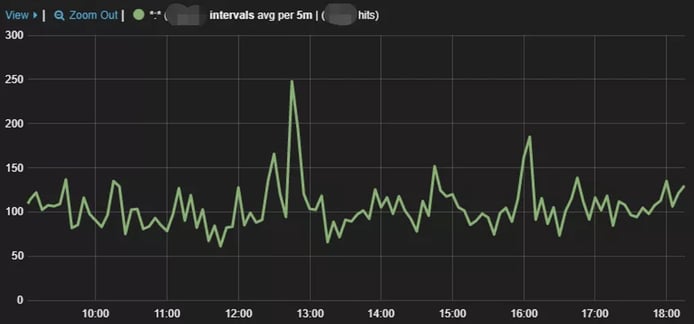
However, ClickHouse could not support high concurrency queries, which is an obvious drawback. Now in most cases, the consumption of CPU is less than 30%. But the usage will be pulled up to a very high level when there comes a peak of the user queries. And if a complicated high-consumption query is sent, usually the 40C CPU will become fully loaded in a very short time with manually processing:
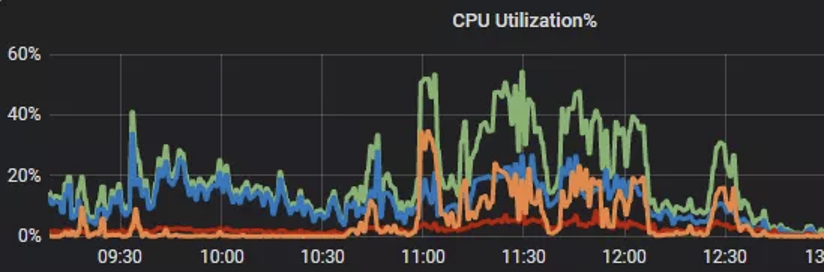
Usually there is a peak of visits at 9:00 AM on the weekdays. For keeping the stability of our system, we set up a mechanism to lower the pressure on the ClickHouse server - establishing cache actively as well as triggering cache by users passively.
On one hand, we’ll cache the query results of the frequently visited pages. On the other hand, after the offline data is updated, we will analyze the user behavior, and cache the relevant data for the users who have visited it during the last 5 days. So that we could lower the peak of the visits.
This mechanism largely replaced the amount of queries which originally happened on ClickHouse. It helped us flatten the peaks of concentrate con-current queries, and could avoid the unlimited expansion of the servers for us as well.
However, there are still pain points with ClickHouse。
Real-time data is fairly important during holidays. Take the new year holiday 2021 as an example, the number of real-time dashboard visits got 10 times higher than usual.
On weekdays, the usage of the CPU would not go over 30%. But it got more than 70% during the holiday, which will bring great risk to the stability of our server.
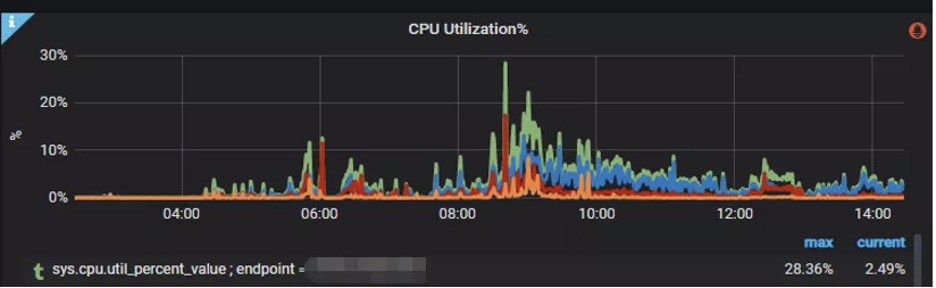
We’ve throttled on the front-end to prevent the high-frequent queries from the users, meanwhile set up the cache on the backend to deal with this situation. Still, it could not be too long for caching the real-time data, 1-2 minutes is the limitation that users could accept.
Also, as we see in the picture below, the hit rate of the offline cache is usually 50% or higher, but the real-time cache can only get to 10%:

On the other hand, we enabled a mechanism of traffic splitting on the server. There are some business requests which have relatively lower permissions, and the amount of data their queries required is also smaller. We set a threshold here based on data analysis. For the users whose permission number is less than 5000, we’ll get their data queries done by MySQL but not ClickHouse. This could bring them the query results in a faster way. Meanwhile, the users with higher permissions will still query their data through ClickHouse.
Although our problems were temporarily fixed in this way, still more new questions came to us one by one:
- The data consistency between ClickHouse and MySQL is hard to guarantee.
- The cost of the hardware increases since there are 2 sets of data.
- ClickHouse does not support standard SQL syntax. We have to maintain 2 different sets of codes, which brings a higher cost to the maintenance as well.
Facing the challenges above, we are aiming for finding a new OLAP solution to reduce the cost of development and maintenance. Meanwhile, the performance of data queries has to be ensured, as well as the applicability of the high concurrency and high throughput scenarios.
We’ve tried engines like Ingite, CrateDB and Apache Kylin™, etc. Each one has some advantages on the cost of hardware or performance. But considering all of the aspects comprehensively, StarRocks became our best choice.
Why StarRocks?
- StarRocks is a high-performance distributed relational columnar database. With the massively parallel processing (MPP) framework, a single node can process up to 10 billion rows of data per second. It supports the star schema as well as the snowflake schema.
- StarRocks clusters are composed of frontends (FE) and backends (BE). Users can use MySQL clients to access StarRocks clusters.
- FE receives queries from MySQL clients, parses and executes SQL statements, manages metadata, executes SQL DDL commands, and keeps the information such as databases, tables, partitions, and tablet copies in Catalog.
- BE manages tablet copies. Tablets are subtables set up by table partitioning and bucketing, stored in a columnar manner. BE creates or deletes subtables under the guidance of FE.
- BE receives the physical execution plan assigned by the FE, and designates the BE coordinator node. It cooperates with other backend workers to complete the tasks as scheduled by the BE coordinator.
- BE reads the local columnar storage engine, gets the data, and quickly filters data through index and Predicate Pushdown.
We chose StarRocks mainly based on the following considerations:
1. Sub-second latency
2. Excellent performance in complex multi-dimensional analysis scenarios such as high concurrency and multi-table queries.
3. Elastic expansion. The online business will not be affected while server expansion. The data rebalance is finished automatically by the BE.
4. Hot backup for the services in the clusters, multi-instance deployment. The overall stability of the clusters will not be affected by the downtime, going offline and abnormalities of the nodes
5. Materialized views and Online Schema Change are supported
6. Compatible with MySQL protocol and support standard SQL syntax
We tested the performance of StarRocks
The queries on HData are mainly through multiple tables. ClickHouse’s single node performance is usually better than clusters, so we chose to test with the single node scenario. We’ve got 3 test cases to compare the performance between ClickHouse and StarRocks.
For that, we set up a StarRocks cluster with 6 virtual machines - 3 for mixed deployment of frontend and backend, 3 for backend. The configurations are as follows.
Version: StarRocks v1.16.2

And the configurations of ClickHouse are as follows.
Version: ClickHouse 20.8

| table_name | row_number(in thousands) |
| overseahotelbasicinfo | 65000 |
| realtimedailyorder | 1000 |
| realtimedailyorder_lastweek | 2000 |
| hotelbasicinfo | 75000 |
| holdroom_monitor_hitel_value | 3000 |
| cii_hotel_eidhotel | 45000 |
| tensity_masterhotel | 10000 |
Test Case 1
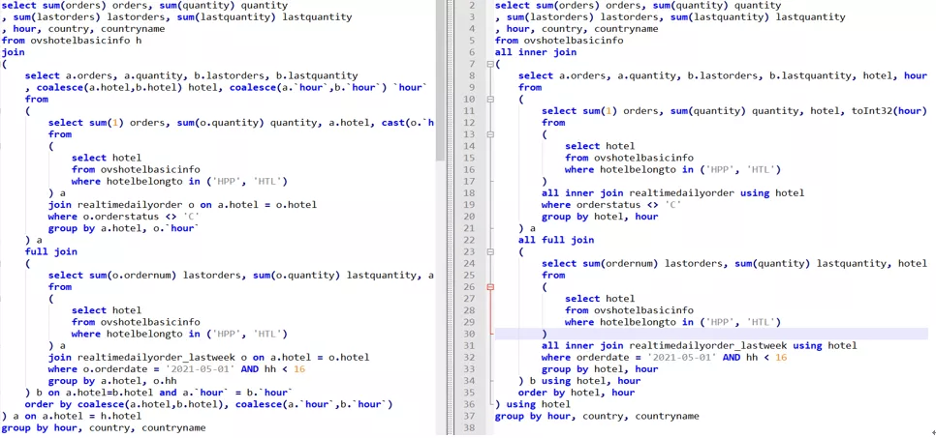
- StarRocks: 547ms
- ClickHouse: 1814ms
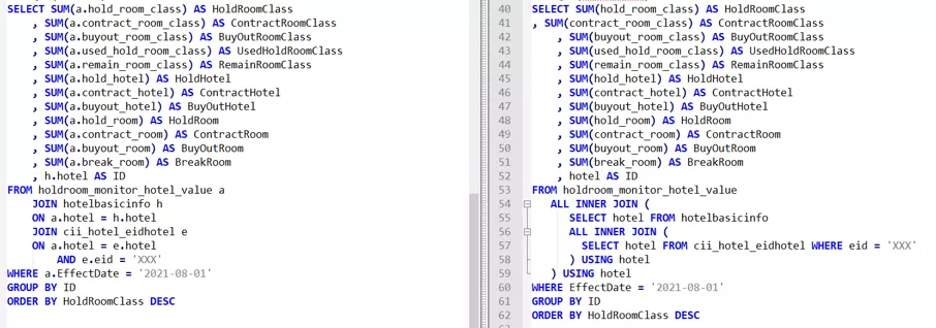
Test Case 2
Test Case 3
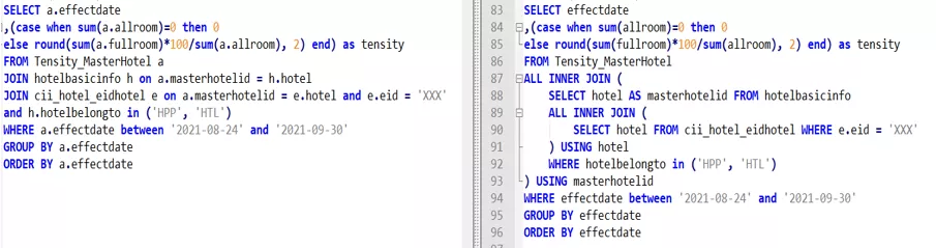
- StarRocks: 387ms
- ClickHouse: 884ms
It’s very clear that the query performance of StarRocks is even better than ClickHouse.
How the StarRocks’ data update mechanism helped our platform
StarRocks provides three different models to update and store data as follows.
- Duplicate Key Model: There are tuples with duplicate primary keys. The tuples will match the ingested data rows one by one. The user could call back all the ingested historical data.
- Aggregate Key Model: There are no tuples with duplicate primary keys. All the ingested data rows with duplicate primary keys are merged into one. The columns of the metrics of these data rows are merged through the aggregation functions. The user could call back the cumulative results of all the ingested historical data, but could not get the detailed historical data any more.
- Primary Key Model: It is the special case of the aggregation model which satisfies the primary key constraint. The primary key will always be unique, and the most recently ingested data row will replace the old one which has the same primary key. This is equivalent to specifying the aggregation function as REPLACE for metrics merge in the aggregation model. Since the function REPLACE will always return the latest data in the data set.
StarRocks provide 5 different ways to import data, so that different data sources are supported. Eg. HDFS, Apache Kafka®, local files, etc. Both asynchronous and synchronous are supported as well.
- Broker Load: Broker Load visits and reads external data sources through the Broker process, and creates import jobs to StarRocks with MySQL protocol. This is applicable when the source data is in the storage systems that are accessible by the Broker process(eg. HDFS).
- Load using Apache Spark™: Load using Apache Spark implements the preprocessing of imported data through Apache Spark™ resources. It will improve the performance of large-scale data importing, and save the calculation cost for StarRocks clusters.
- Stream Load: Stream Load is a synchronously executed method of data importing. It sends requests through HTTP protocol, and imports local files or data streams into StarRocks. It will also wait for the status that the system returns and decide whether the data importing is successful.
- Routine Load: Routine Load provides a function to automatically import data from a specified data source. The user submits routine import jobs through MySQL protocol, generates a daemon thread, continuously reads data from the data source (eg. Apache Kafka) and imports the data into StarRocks.
- Insert Into: This is similar to the INSERT statement in MySQL. You can insert data through statements such as INSERT INTO tbl SELECT ... or INSERT INTO tbl VALUES(...).
There are mainly two types of data in our HData platform: real-time data and T+1 offline data.
We chose to import real-time data through Routine Load on StarRocks, mainly relying on the Update model. And for the T+1 offline data, we imported it through the Stream with the duplicate model.
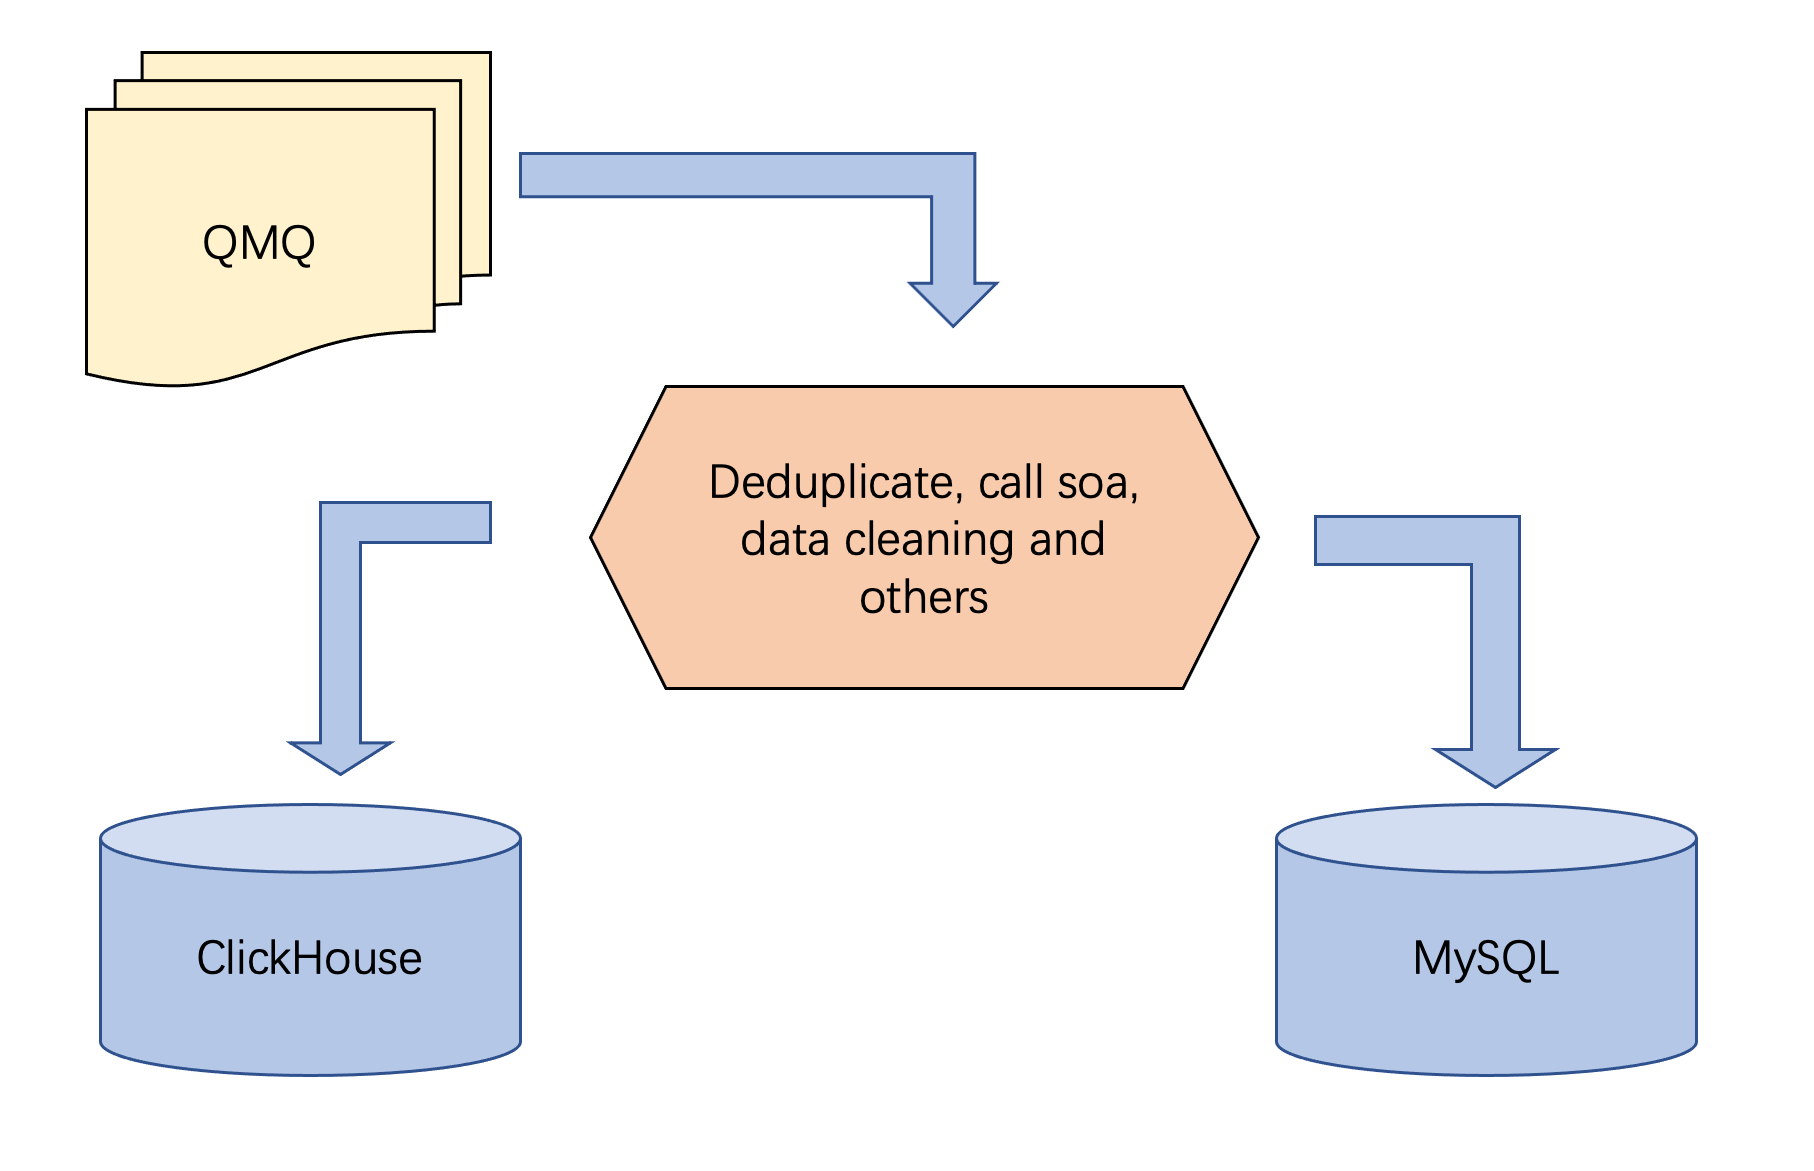
Real-time data importing is implemented through QMQ, a message queuing system originally developed by Trip.com. The former real-data importing process is shown as below:
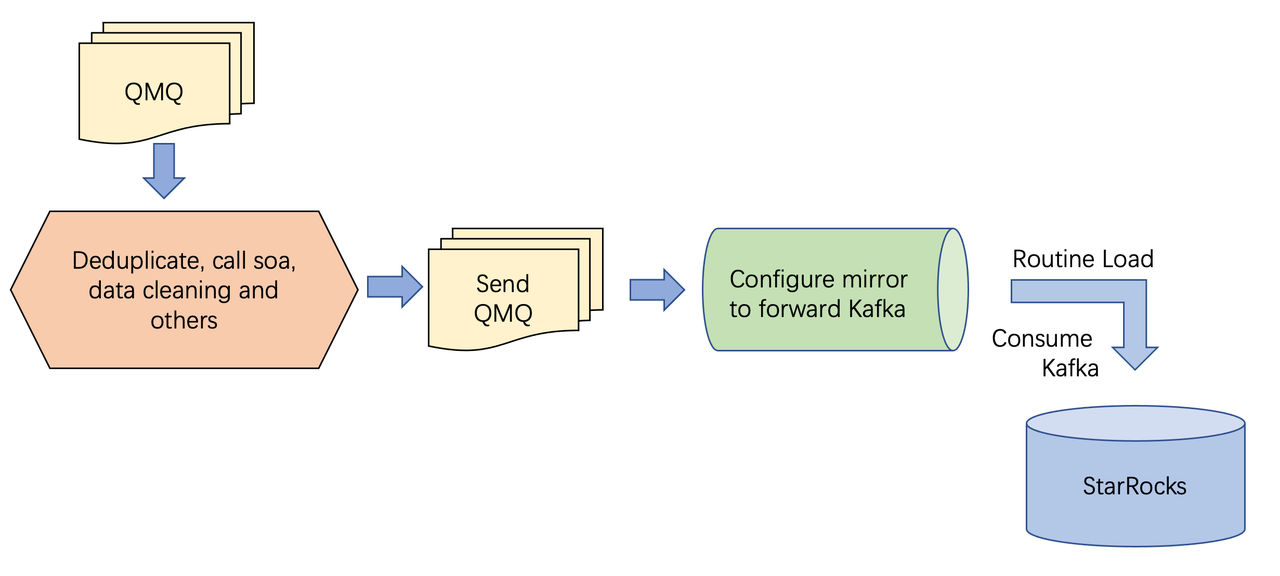
After we integrated with StarRocks, the process became:
But soon we ran into a new problem. There was a scenario which was to subscribe to the status messages of order changes. We used the order ID as the primary key in the downstreams and employed the StarRocks update model to get the data merged. And we would provide the data that only contained non-cancelled orders for showcasing externally.
After receiving the status message, we would also need to add some fields by calling external APIs, then merge the data at the final step. It would bring much pressure to the interface if we call it once whenever we receive a message, so we chose the batch way here.
Here comes the problem. Apache Kafka can not guarantee the sequence of the global messages, only the sequence in specific partitions can be guaranteed. If there are 2 records for the same order but have different status, and they are placed in 2 different partitions, the Routine Load could not know beforehand which one would be dealt with first. If the one with status “canceled” is processed first, then after the other status got processed, the status of the order would wrongly become “active”. This will definitely bring errors for later analysis.
We’ve also considered going with native Apache Kafka instead of our QMQ, taking the order ID as the key to specifying which partition to send the record to. But this will need extra development and the cost is high as well.
Finally we chose a compromise. While the message is merged, we also set up a log table with StarRocks duplicate model. There are only order IDs, order status and message timestamps in it. Meanwhile, there is a timertask that will sort the data for the records with the same order IDs, and only keep the one with the latest timestamp. Then it will match the order IDs to the original table and update the status if necessary. So that we could make sure that the records in Apache Kafka will always have the correct status.
We used Zeus (a data synchronization platform developed by us) to do ETL and data import for our T+1 data
How StarRocks achieves Disaster Recovery and High Availability
Our requirements on Disaster Recovery(DR) are fairly high. There will be routinely company-level DR exercises from time to time. StarRocks already has a dramatic mechanism of disaster recovery, and we built up a structure for high availability which accommodates us on it.
- Servers are deployed in 2 server rooms separately, and serve the data with traffic splitting as 5:5. The load balancing of frontend nodes that provide service externally is implemented with configuration items. They could be modified and will take effect in a real-time manner.
- All the frontend and backend processes are guarded by the supervisor to ensure that they could be automatically pulled up when exited unexpectedly.
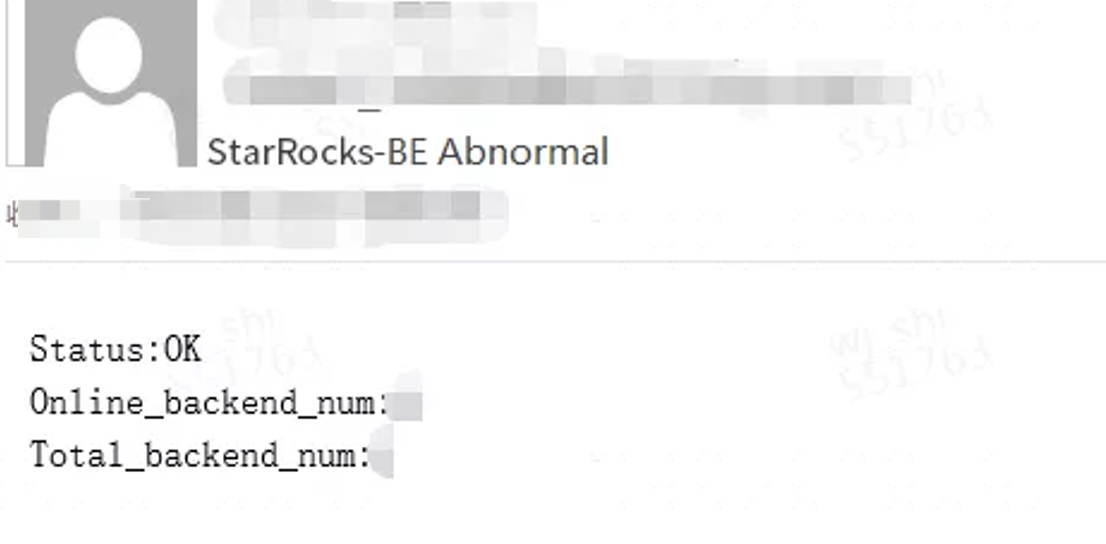
- When any of the frontend nodes fails, the surviving follower will immediately elect a new leader node to provide services. But the applications cannot get it immediately. So we set up a timer task to perform the health checking to the frontend server regularly. Once it gets the failure of the frontend nodes, the node will be removed immediately and a SMS will be sent to our developers.

- When a backend node fails, StarRocks will automatically balance the replicas. It will not affect the service they provide. Meanwhile, we also have a timer task to do the health checking for the nodes. An email will be sent to our developers when there is a backend node failure.
- On the other hand, we configured alarms for the hardware indicators of each server. Once there are any abnormalities of the CPU, MEM or disk space of the server, developers would get notifications and start to fix the issues right away.
With StarRocks, what’s next?
At the moment, 70% of the real-time data scenarios on our platform are already deployed on StarRocks. The average query response is about 200ms. There are only 1% of them which would take more than 500ms. Meanwhile, we only need to maintain one set of data and one set of codes, the cost of human resources and hardware has significantly decreased.
Average response time (ms)
Query length interval distribution

Future plan
- Migrate the rest of the real-time scenarios to StarRocks.
- Migrate our offline scenarios to StarRocks as well, and unify all of the OLAP analysis scenarios with StarRocks gradually.
- Improve the mechanism of monitoring on StarRocks to make it more robust.
- Separate hot and cold data by reading Apache Hive™ external tables, reducing the cost of the hardware.
Apache®, Apache Spark™, Apache Kafka®, Apache Hive™, Apache Kylin™ and their logos are either registered trademarks or trademarks of the Apache Software Foundation in the United States and/or other countries.