


Join StarRocks Community on Slack
Connect on Slack“Ideas are worth nothing, unless implemented.”
- Steve Jobs, Founder of Apple
Data and analytics today are considered the key enabler of innovation and productivity in every business function and every industry sector. According to CGOC, 60% of data that’s collected today, has already lost some or all of its business value by the time data is captured [1]. This is because most businesses continuously evolve and adapt due to changing customer preferences, MAD (mergers, acquisitions, and divestures), regulations, intense competition, and more.
So, if an organization uses last quarter’s data to make a decision for today’s problem, they may derive erroneous insights and even make a wrong decision potentially affecting the performance of the business. Hence companies today across different industry sectors are looking at real-time analytics or rather near-real time analytics to make accurate and timely decisions.
This blog, the third and the last one as part of my 3-series blog is to help the data and analytics community understand and guide the implementation of real-time analytics solutions in business enterprises. The first blog discussed the fundamentals of real-time analytics [2] and the second blog looked at use-cases for real-time analytics [3]. This blog will look at the solutions to implement real-time analytics to help businesses derive insights from the available data with minimal delay.
However, implementing real-time analytics solutions is not a technical endeavor. To implement it holistically, it involves five key capabilities or building blocks: data culture, data literacy, quality data, tools and technology, and data governance as shown below. Let us look at these five components for implementing real-time analytics in more detail.
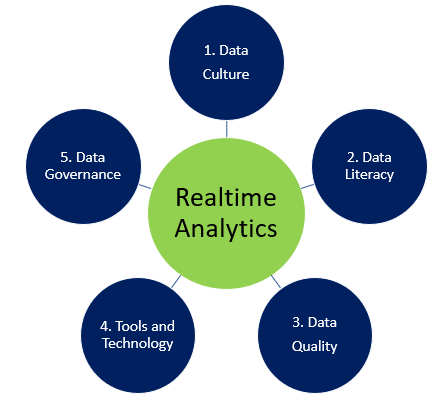 Figure 1: Enablers for Implementing Real-time Analytics
1. Data Culture
Data Culture is the collective behaviors and beliefs of people who value, practice, and encourage the use of data for improved performance in business operations, compliance and decision-making. According to Forrester, organizations that use data to derive insights for decision-making are almost three times more likely to achieve double-digit growth [4].
A McKinsey report says data-driven organizations provide EBITDA (Earnings Before Interest, Taxes, and Depreciation) increases of up to 25 percent [5]. So, how can an organization build a strong data culture and leverage the power of real-time analytics? While there are many strategies, below are three key enablers for business enterprises to build a data driven culture.
1.1. Inculcate the Service Culture
Data-driven culture should always start at the top where the C-suite makes decisions on growth, costs, and risks using data and not purely on intuition. In this regard, focus on a service culture to consistently create value and trust with the business stakeholders. But how does the service culture relate to real-time analytics? To provide consistent service, there has to be a reliable frame of reference on the service levels and this reliable frame of reference comes from data by treating everyone in the company as a customer. Basically, treating and serving everyone in the company not only creates a foundation for stronger and consistent relationships, but also promotes the use of data to grow and improve.
1.2. Focus on Measurement
So, how can one grow and improve? At the core, data and analytics is about measurement to improve performance. This is because measurement creates visibility, and visibility drives business performance. This is realized by having a robust KPI measurement framework with both leading and lagging metrics. However, the KPI framework get its context and relevance only when the measurements are compared against four key elements - targets, tolerances limits, control limits, and specification limits.
1.3. Emphasize Consensus Culture
A strong data culture thrives on consensus. A consensus-based culture relies on insights driven by data, unlike the hierarchical culture where the decision-making is based primarily on title, position, and seniority. In a consensus culture, validation of the decision is against the business objectives, questions, KPIs, assumptions, ethics, and payoffs with the right feedback mechanisms so that the problem is framed correctly and the decision is made with minimum bias.
2. Data Literacy
The second building block in implementing real time analytics is data literacy. Data literacy is the ability to understand and communicate data and insights. According to Gartner, data literacy is the ability to read, write and communicate data in context, with an understanding of the data sources and constructs, analytical methods and techniques applied, and the ability to describe the use case application and resulting business value or outcome [6]. So, how can the data literacy in the organization be improved?
2.1. Implement the Training Program
Data and analytics is a multi-disciplinary field that needs expertise in business, mathematics, social science, computer science, and more. While these hard skills are important, the “5C” soft skills such as communication, collaboration, critical thinking, curiosity, and creativity. are equally critical to derive business value from real-time analytics. Hence the data literacy training curriculum should include relevant topics from the above domains and assess employees’ current skill levels, and lay out appropriate learning paths at technical level, organizational level, and at the personal level.
2.2 Leverage Descriptive Data Analytics
While training is an important aspect to improve data literacy, data teams typically learn by doing and collaborating. A formal training program, supported by hands-on experience can enhance the application and adoption of real-time analytics in the enterprise. In this regard, descriptive analytics based historical data are accurate and consistent and can be used to form a common and reliable communication terminology in the organization. For example, the accuracy of the sales revenue in the previous quarter (descriptive analytics) is generally more accurate than the predicted accuracy of the sales revenue in the next quarter (predictive analytics).
3. Quality Data
What is quality data in business? Data is considered to be of high quality in business if they are fit for use in operations, compliance and decision making [7]. But considering the enormous amounts of data companies are capturing and storing these days, achieving and sustaining data quality is very complex and challenging. If the data quality is low, the insights derived from real-time analytics cannot be relied upon. Below are the strategies to improve data quality in the organization.
3.1. Profile Data
Assess or profile the data to know where you stand in data quality so that appropriate strategies can be developed to improve data quality. Data profiling is the process of examining, analyzing, reviewing, and summarizing data to gain insights on the current state of data quality. Profiling data should cover the measures of both centrality and variation on data quality dimensions such as accuracy, completeness, integrity, timeliness, and so on. This assessment process can serve as the “baseline” on where the enterprise currently stands on data quality so as to take corrective actions.
3.2. Follow the Minimalistic Approach to Data Capture
Today majority of the data that is captured by business is not used. Research by IBM and Carnegie Mellon University found that 90 percent of the data in a typical business enterprise is unused or dark data [8]. Thus, improving data quality becomes challenging as lot of efforts goes wasted on improving the quality of data that is never used. A “less data, more efficiency” approach makes it is easier to save time, reduce costs, while improving data quality. In this regard, organization should follow principle of data minimalism and capture those data elements in the SoR (System of Record) as an authoritative data source.
3.3. Build robust data integration capabilities
In real-time analytics data is sourced from various systems – internal and external. This data is integrated in a unified or integrated repository like the data warehouses. A data warehouse which manages large amounts of data enables quick querying and reduced latency thereby supporting real-time analytics. Basically, the selection of best practices to integrate data is based on four key factors.
- Pull v/s Push based whether it is the sender (server) or receiver (client) who takes the initiative in the integration process.
- Number of systems in scope for integration.
- The volume of data to be integrated.
- Sequence of Transfer, Transpose and Orchestration (TTO).
4. Tools and Technology
Technically, real-time analytics solutions offer business value by minimizing latency - data latency and query latency. Data latency is a measure of the time from when data is generated to when it is queryable. Query latency is the amount of time it takes to execute a query on the data in the data warehouse and get the output. However, reducing data latency and query latency for real-time analytics is extremely challenging due to complex data pipelines, de-normalized tables, processing database updates and more. The StarRocks real-time analytics solution from CelerData solves these challenges and offers proven solutions for implementing real-time analytics. So, what are the capabilities that make StarRocks achieve efficient real-time analytics.
4.1 Eliminate De-Normalized Tables
Though denormalization increases performance of a datawarehouse, it creates redundant data taking more storage space. Also, denormalization slows down data updates affecting the timeliness of the insights. StarRocks works directly on the datawarehouse tables and improves the query performance by partitioning and bucketing of any table and creating tablets. Partitioning is decomposing the table into multiple partitions according to timestamps (a day, a week, and so on) and bucketing is subdividing the tables based on the hash function of one or more table columns. These kinds of table divisions into tablets allow StarRocks to conduct parallel processing on all tablets when executing SQL statements, and fully utilize the computing power.
4.2 Leverage Massively Parallel Processing (MPP)
Massively parallel processing (MPP) is a collaborative processing technique using two or more processors to dramatically increase the processing speed. StarRocks adopts MPP where the query request is split into numerous logic and physical execution units. Each unit knows as the query fragment runs simultaneously on multiple nodes with dedicated resources (CPU and memory). Basically, MPP makes efficient use of the system resources and enhances the query processing performance.
4.3 Harness Native Vectorized Execution Engine
Native vectorized execution engine feature allows StarRocks to fully utilize the processing power of the CPU. More specifically, native vectorized execution engine supports column-oriented data management and processing. As a result, this kind of engine allows StarRocks to store data, organize in-memory data, and run SQL operators by columns. In this way, column-oriented data management makes effective use of CPU, cache, and column-oriented computation and creates fewer virtual functions and selection statements there by improving the efficiency of the data pipelines.
4.4 Use Column-oriented Storage Engine for Real-time Data Updates
StarRocks adopts columnar storage engines where data is stored in column format. In this way, StarRocks can obtain higher compression ratios and reduce storage costs when using more efficient encoding techniques. On the other hand, column-oriented storage speeds up database query performance by reducing I/O. In addition, StarRocks uses the primary index and secondary indexes, avoids sort, and merge operations to quickly filter large amounts of data. All these techniques guarantee extremely fast query performance in databases with large numbers of updates resulting in reduced latency.
4.5 Implement Intelligent Views for better Scalability
A core feature of any good real-time analytics solution is supporting concurrent users. StarRocks allows you to keep the current BI Tools through standard SQL. In addition, the Intelligent views feature provided by StarRocks helps to automatically update the changes made to the datawarehouse tables. Also, when StarRocks conducts query planning, it will rewrite queries to fetch results from appropriate materialized views in order to increase the speed of queries.
5. Data Governance
The fifth part of implementing real-time analytics solutions is data governance. According to the Gartner, “Data governance is the specification of decision rights and an accountability framework to ensure the appropriate behavior in the valuation, creation, consumption and control of data and analytics.” [9]. The main purpose of data governance is to securely manage the quality of data in the entire data lifecycle (DLC) so that right people are managing the right data in the right manner. Below are key practices to support the implementation of data governance for real-time analytics.
5.1 Balance Centralized or Decentralized Approaches
There is no one-size-fits-all approach to data governance. Execution of data governance can be centralized or decentralized. Although a centralized approach to data governance program is a more traditional approach, it requires strict rules and procedures. A more democratized or decentralized approach, opens the data to more users and can lead to faster decision-making. Selection of centralized or decentralized approaches is striking the best balance between control and flexibility. Regardless, every organization a combination of both centralized or decentralized data governance approaches.
5.2 Implement the 3Ps – Policy, Process and Procedures.
The second aspect in implementing data governance is how to govern data. This is mainly about setting up the 3Ps – Policy, Process, and Procedures
- A policy is a rule that helps an organization govern the data and manage risks based on business requirements and standards. A standard – internal or external, makes the policy more meaningful and effective. Sample data standards include naming standards, taxonomy, data modeling standards, data architecture standards, and so on.
- A business process is a series of related, structured activities performed by the data governance team to accomplish a specific objective. These processes could be on data quality surveillance, data exchange, data lineage tracking, data profiling, validation of compliance to regulations, data archiving, and more.
- A procedure is a sequence of steps or work instructions to complete an activity within a process. For example, the data archiving procedures could be inventorying and determining which data must be archived, assigning a retention schedule for each data object, and so on.
5.3 Set up Organizational Mechanisms.
The third element of data governance is setting up organizational mechanisms to govern data. Based on the work on Gregory Vial [10], the three organizational mechanisms to govern business data are structural, procedural and relational:
- Structural mechanisms are about the creation of data governance roles to enable the creation of 3Ps i.e., policies, process and procedures. A good data governance organization includes the steering committee with three main groups - data owners, data stewards, and data custodians.
- Data owner, who is from the business is accountable for the data and makes decisions on the right to access and usage.
- Data stewards are from the various business units and they are responsible for managing the data of their respective functions.
- Data custodians are from IT and they are responsible for the safe and secure custody, integration, and storage of data.
- Procedural mechanisms are used by the organization to ensure compliance to the structural mechanisms. This is where the data owner, the data stewards, and the data custodians come together to monitor of data quality with appropriate data profiling KPIs.
- Relational mechanisms include key activities to support collaboration between different data governance teams. Effective data governance requires data owners, data stewards, and data custodians to jointly take complete responsibility for the quality of the data in the enterprise. The data stewards and data custodians who are responsible for data quality work under the strategic direction of the data owner who is accountable for the quality of the data object.
Today, organizations across the world are looking at real-time analytics to quickly derive insights from data to make faster decisions for better business results. While there are many options to improve the success rates, one solution to improve the adoption of data analytics is to offer the power of real-time analytics directly to users who are closer to data and business. Real-time analytics can turn data into insights at speed and scale.
While the use-cases for real-time analytics are many and only limited by one’s imagination and creativity, the five core or key capabilities or building blocks: data culture, data literacy, quality data, technology, and data governance, discussed here will increase the odds of successfully transforming real-time analytics into tangible business results.
References
- https://www.globenewswire.com/news-release/2018/11/15/1652360/0/en/CGOC-Survey-Shows-Enterprises-Still-Face-High-Risk-from-Immature-Information-Governance-Processes.html
- https://celerdata.com/blog/real-time-analytics-what-so-what-and-now-what
- https://celerdata.com/blog/practical-use-cases-for-real-time-analytics-celerdata
- Evelson, Boris, “Insights Investments Produce Tangible Benefits — Yes, They Do”, https://www.forrester.com/blogs/data-analytics-and-insights-investments-produce-tangible-benefits-yes-they-do/, May, 2020
- Mckinsey2, "Insights to impact: Creating and sustaining data-driven commercial growth", https://www.mckinsey.com/business-functions/growth-marketing-and-sales/our-insights/insights-to-impact-creating-and-sustaining-data-driven-commercial-growth,Jun 2022
- Gartner, "Survey Analysis: Third Gartner CDO Survey — How Chief Data Officers Are Driving Business Impact", https://www.gartner.com/en/documents/3834265, Nov, 2017
- Southekal, Prashanth, “Data for Business Performance”, Technics Publications, 2017
- https://www.forbes.com/sites/forbestechcouncil/2020/09/25/illuminating-dark-data-in-enterprises/
- Gartner1, “Data Governance”, https://www.gartner.com/en/information-technology/glossary/data-governance, 2022
- Vial, Gregory, "Data Governance in the 21st-Century Organization", MIT Sloan Management Review, Oct, 2020
About the Author
 Dr. Prashanth Southekal is the Managing Principal of DBP Institute (www.dbp-institute.com), data and analytics consulting, research and education firm. He is a Consultant, Author, and Professor. He has consulted for over 75 organizations including P&G, GE, Shell, Apple, and SAP. Dr. Southekal is the author of two books — “Data for Business Performance” and "Analytics Best Practices” — and writes regularly on data, analytics, and machine learning in Forbes.com, FP&A Trends, and CFO.University.
ANALYTICS BEST PRACTICES is in the top 100 analytics books of all time and in May 2022 was ranked #1 by BookAuthority. Apart from his consulting pursuits, he has trained over 3,000 professionals worldwide in Data and Analytics. Dr. Southekal is also an Adjunct Professor of Data and Analytics at IE Business School (Madrid, Spain). CDO Magazine included him in the top 75 global academic data leaders of 2022. He holds a Ph.D. from ESC Lille (FR) and an MBA from Kellogg School of Management (U.S.). He lives in Calgary, Canada with his wife, two children, and a high-energy Goldendoodle dog. Outside work, he loves juggling and cricket.